

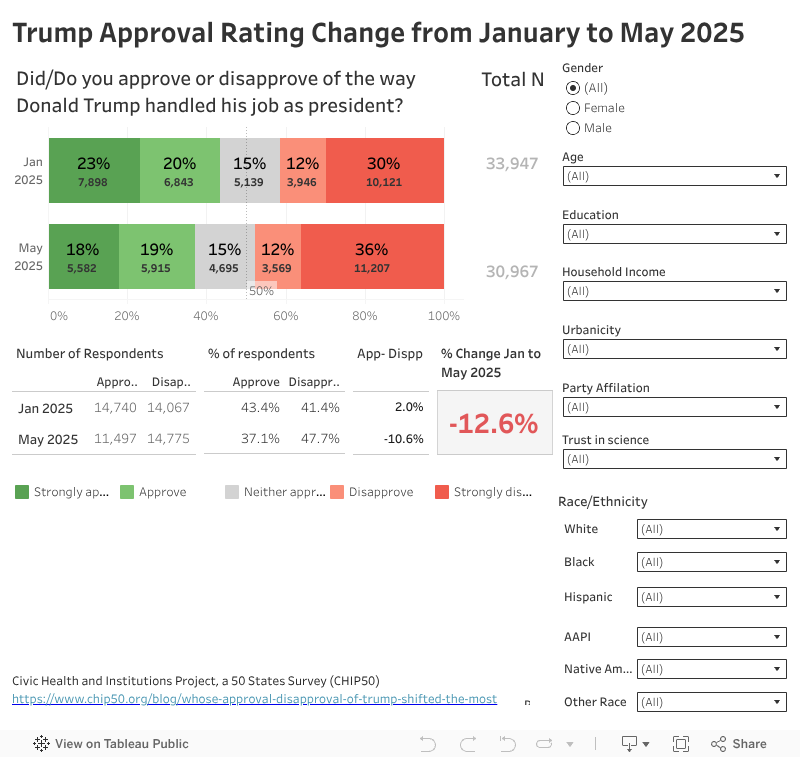
A long list of polls show that approval of Donald Trump has slipped since he was inaugurated. Our analysis comparing Trump’s approval rating from right before he was inaugurated to the present suggests the same. Overall, his net approval (Percent approve minus percent disapprove) was positive in early January 2025, at +2%; that has dropped to -10.6%, for a drop in net approval of 12.6%. Because of the scale of CHIP50, we can evaluate which slices of public approval have changed the most. We note that our surveys are large-scale and take place over extended periods (data collection for the first survey was from November 9 to January 10; and the second from April 10 to June 5). The extended periods of the data collection yield very large sample sizes and allow us to examine larger-scale shifts in opinion with precision among small slices of the population. This is not something most publicly available surveys allow. The flip side is that the estimates below of approval of Trump are not precise with respect to time, since they both took place over two months. We also note that we use 5-point scales for approval rather than 4-point scales, meaning that we have a “neither approve nor disapprove” category. Most public-facing surveys use 4-point scales, forcing all respondents to pick a side on the scale. In any case, when comparing our data to other surveys, we will have lower numbers for “approve” and “disapprove,” since about 15% of our respondents pick this middle category.
Below is an interactive visualization that allows you to slice up public opinion with respect to fairly small subpopulations, and see how the relative approval of Trump has changed in the early months of his administration. Below the visualization, we summarize some of our observations about the shifts in net approval (the differences between approve and disapprove).
Age: there have been big drops in approval for Trump among younger respondents
Our earlier analyses comparing changes in voting from 2020 to 2024 highlighted the crucial role that swings among younger, non-white, and less educated voters played in Trump’s victory in 2024.
Net approval among younger voters has shifted away from Trump more than among older voters. The net shift in approval of adults 30 and younger has been a -19.1%; as compared to a drop of 11.7% for 31 to 60 year-olds; and a drop of 8.9% for 60+ year-olds.

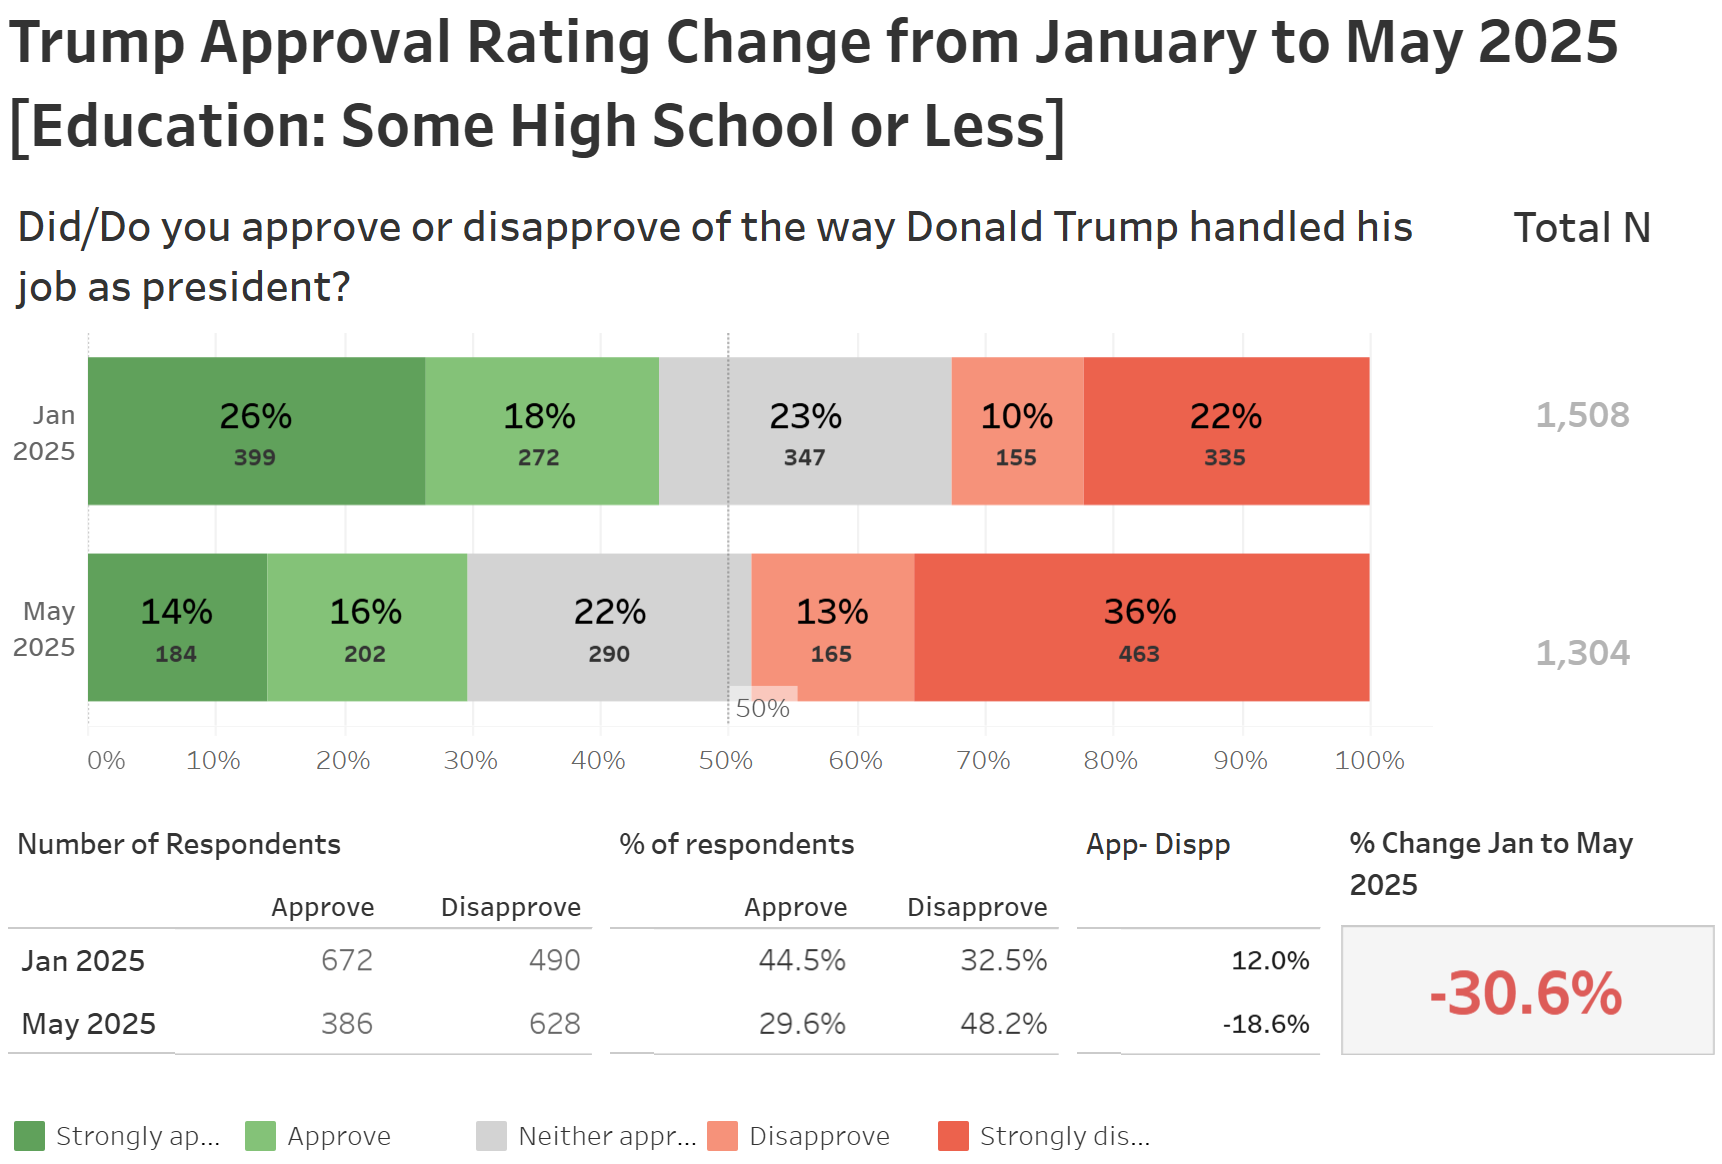
Education: big drops of approval for Trump among less educated voters
The election was also notable for a continued shift of less educated voters toward Trump. The data suggest a rapid shift of less educated voters away from Trump since he was inaugurated. Respondents with some high school or less education have shifted 30.6% away from Trump; by contrast, individuals with a graduate degree shifted slightly (1.4%) towards Trump.
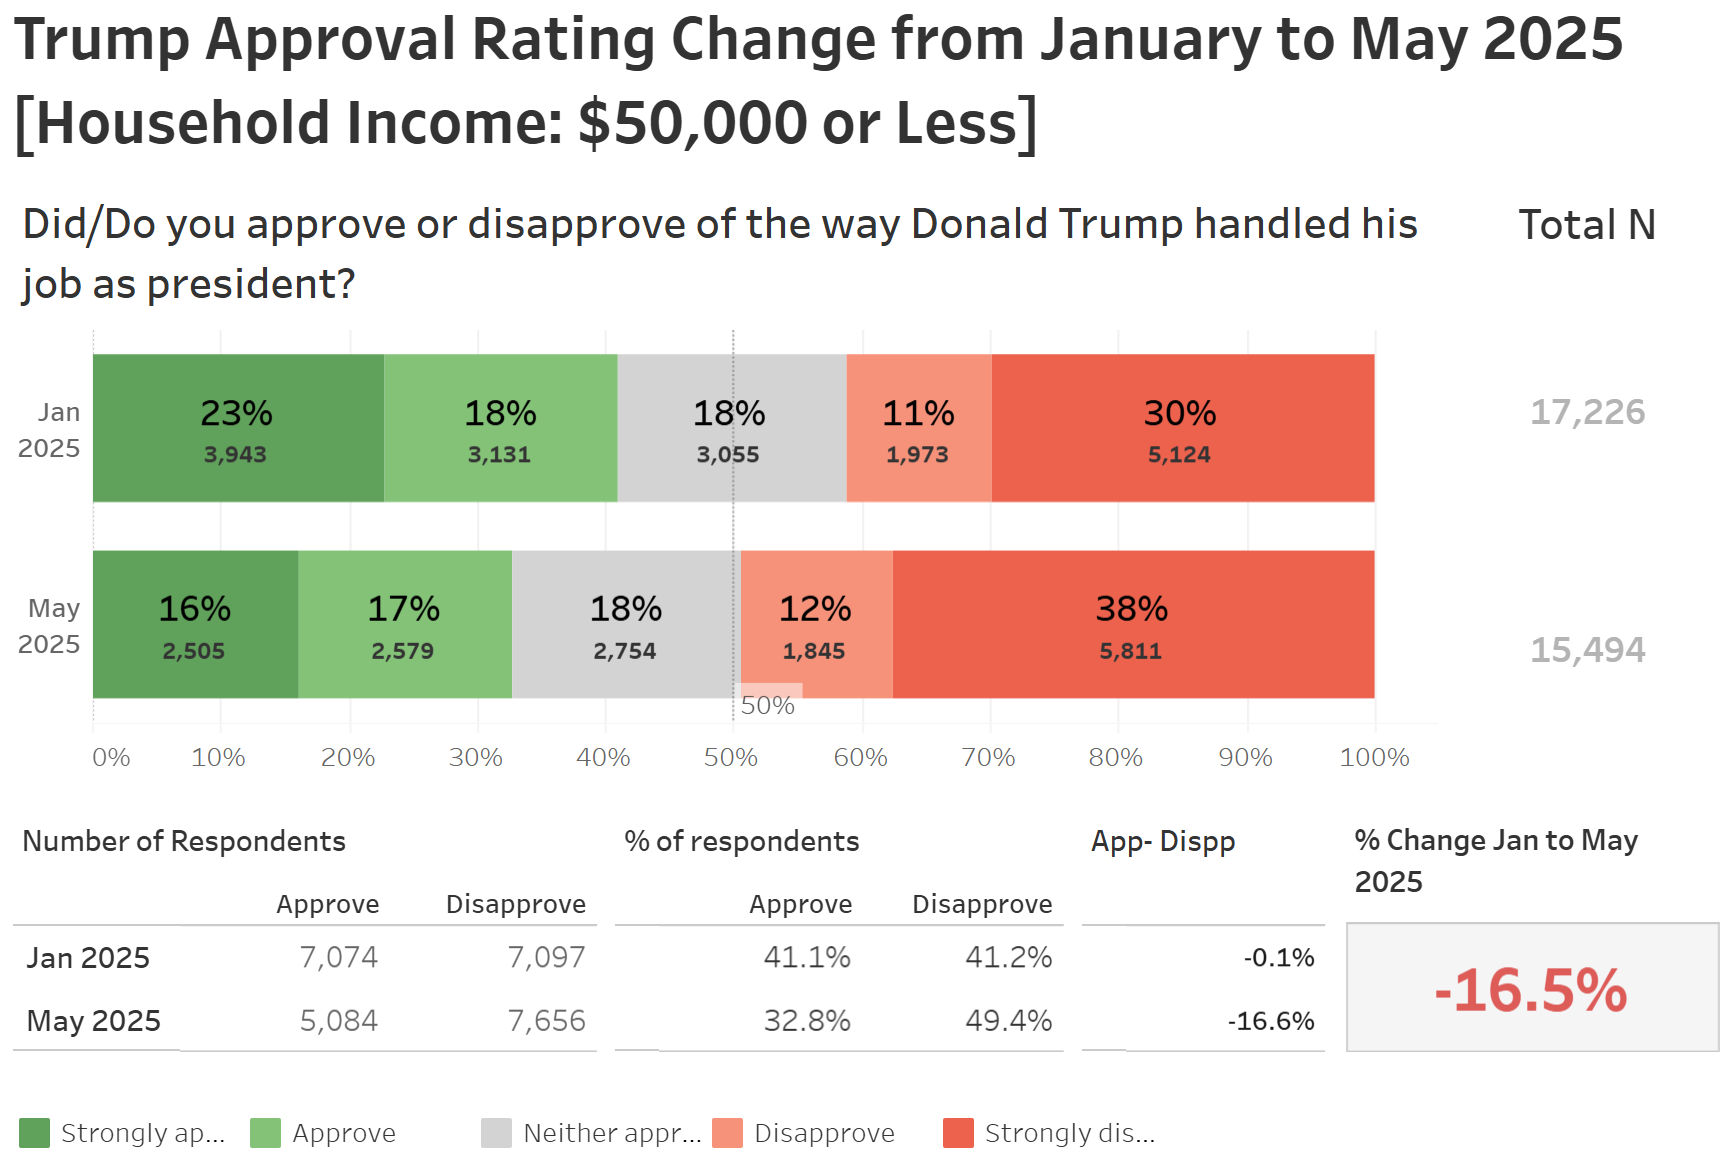
Income: bigger drops of approval for Trump among lower-income voters
Similar to education, lower-income voters also shifted towards Trump in 2024. However, also similar to education, they have shifted away from Trump since he has taken office. Respondents who report a household income of $50,000 or less have shifted away from Trump by 16.5%; those more than $50,000 but less than $100,000 by 12.3%; while those who say they earn $100,000 or more have only shifted away from Trump by 2.8%.
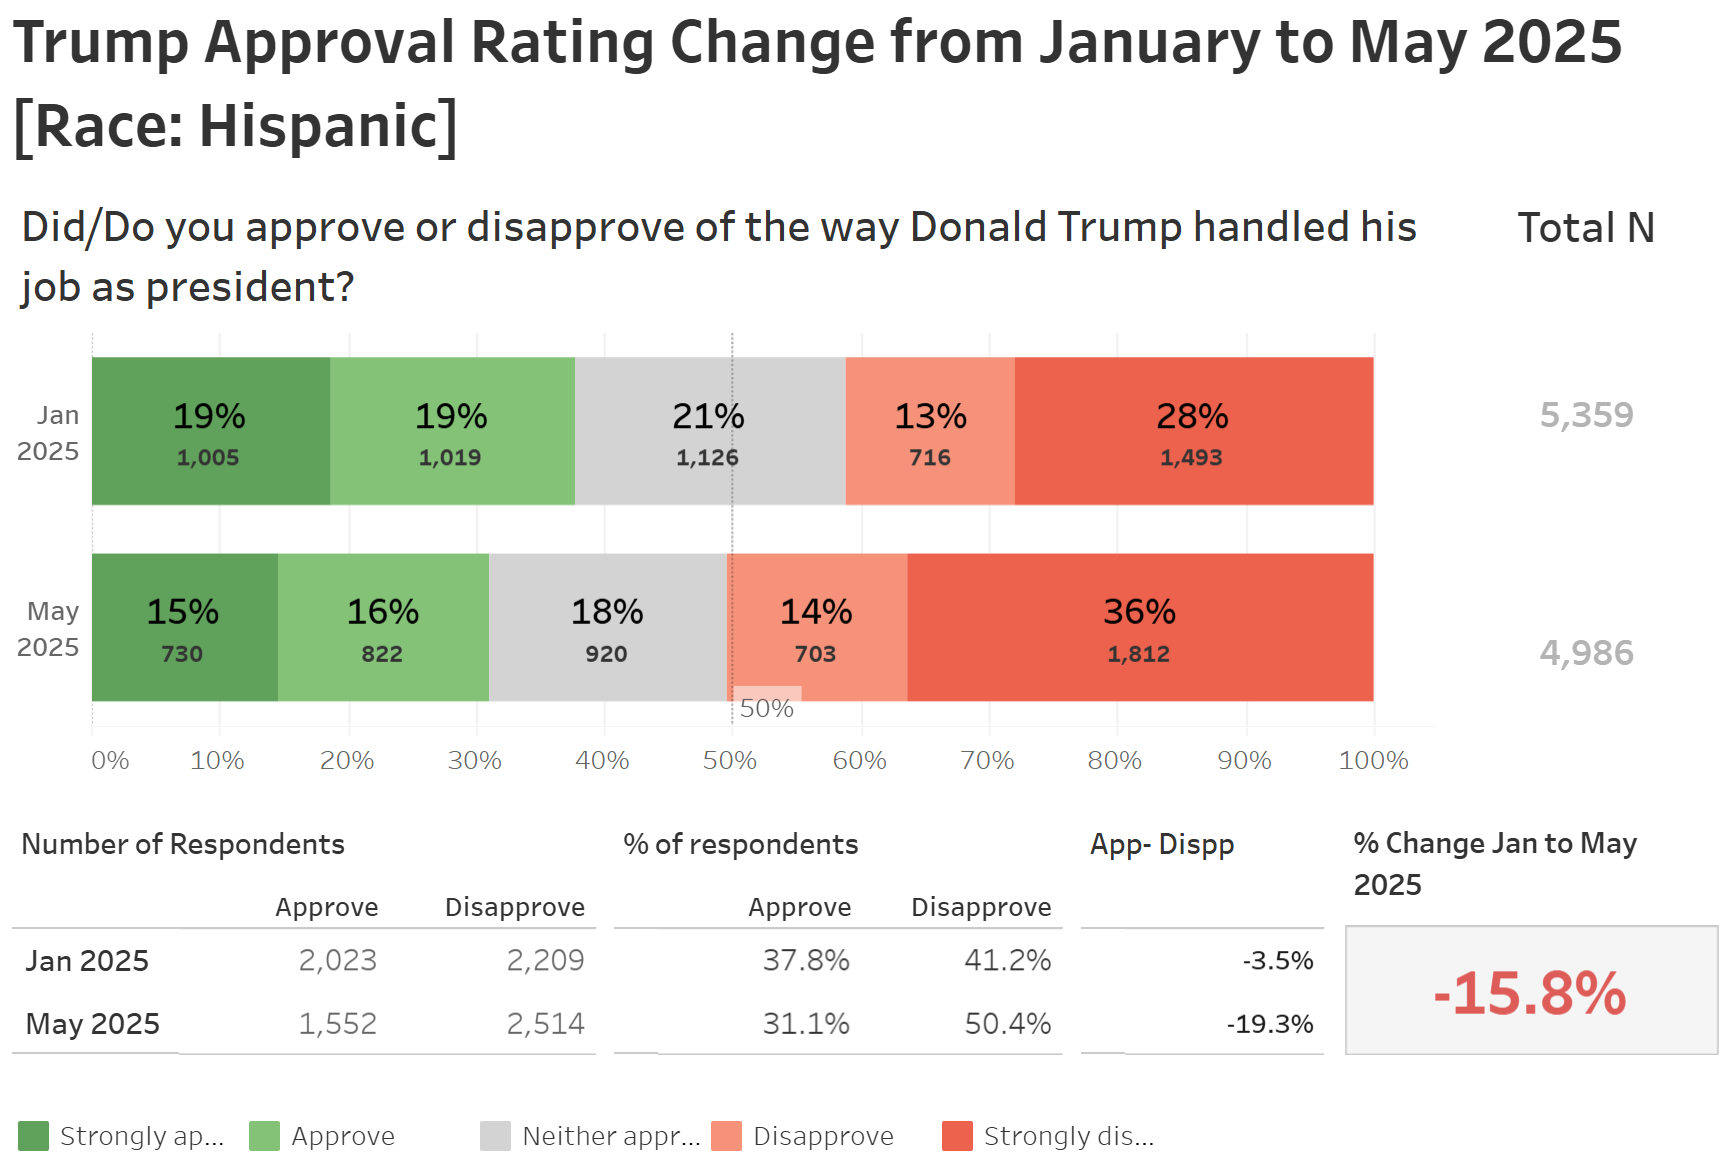
Race/ethnicity: big drops of approval for Trump among Hispanic and non-white voters
We measure race/ethnicity with a single question that asks respondents to identify which racial or ethnic group best describes them (with seven distinction options). Respondents can choose all that apply. We find, generally, that White non-Hispanic respondents (individuals who checked White and no other racial/ethnic identity) shifted less than other voters, with a drop of approval of 11.3%. We find somewhat larger shifts among non-white voters away from Trump. Black voters shifted 13.7%; Hispanics 15.8%; Asians and Pacific Islanders 13.%. Our data suggest a substantial divide among Hispanics, where net approval of non-White Hispanics (individuals who selected Hispanic and did not select White) dropped by 25.1 points, and approval of White Hispanics (individuals who selected both Hispanic and White and no other racial group on our survey) barely shifted, dropping by only .4%
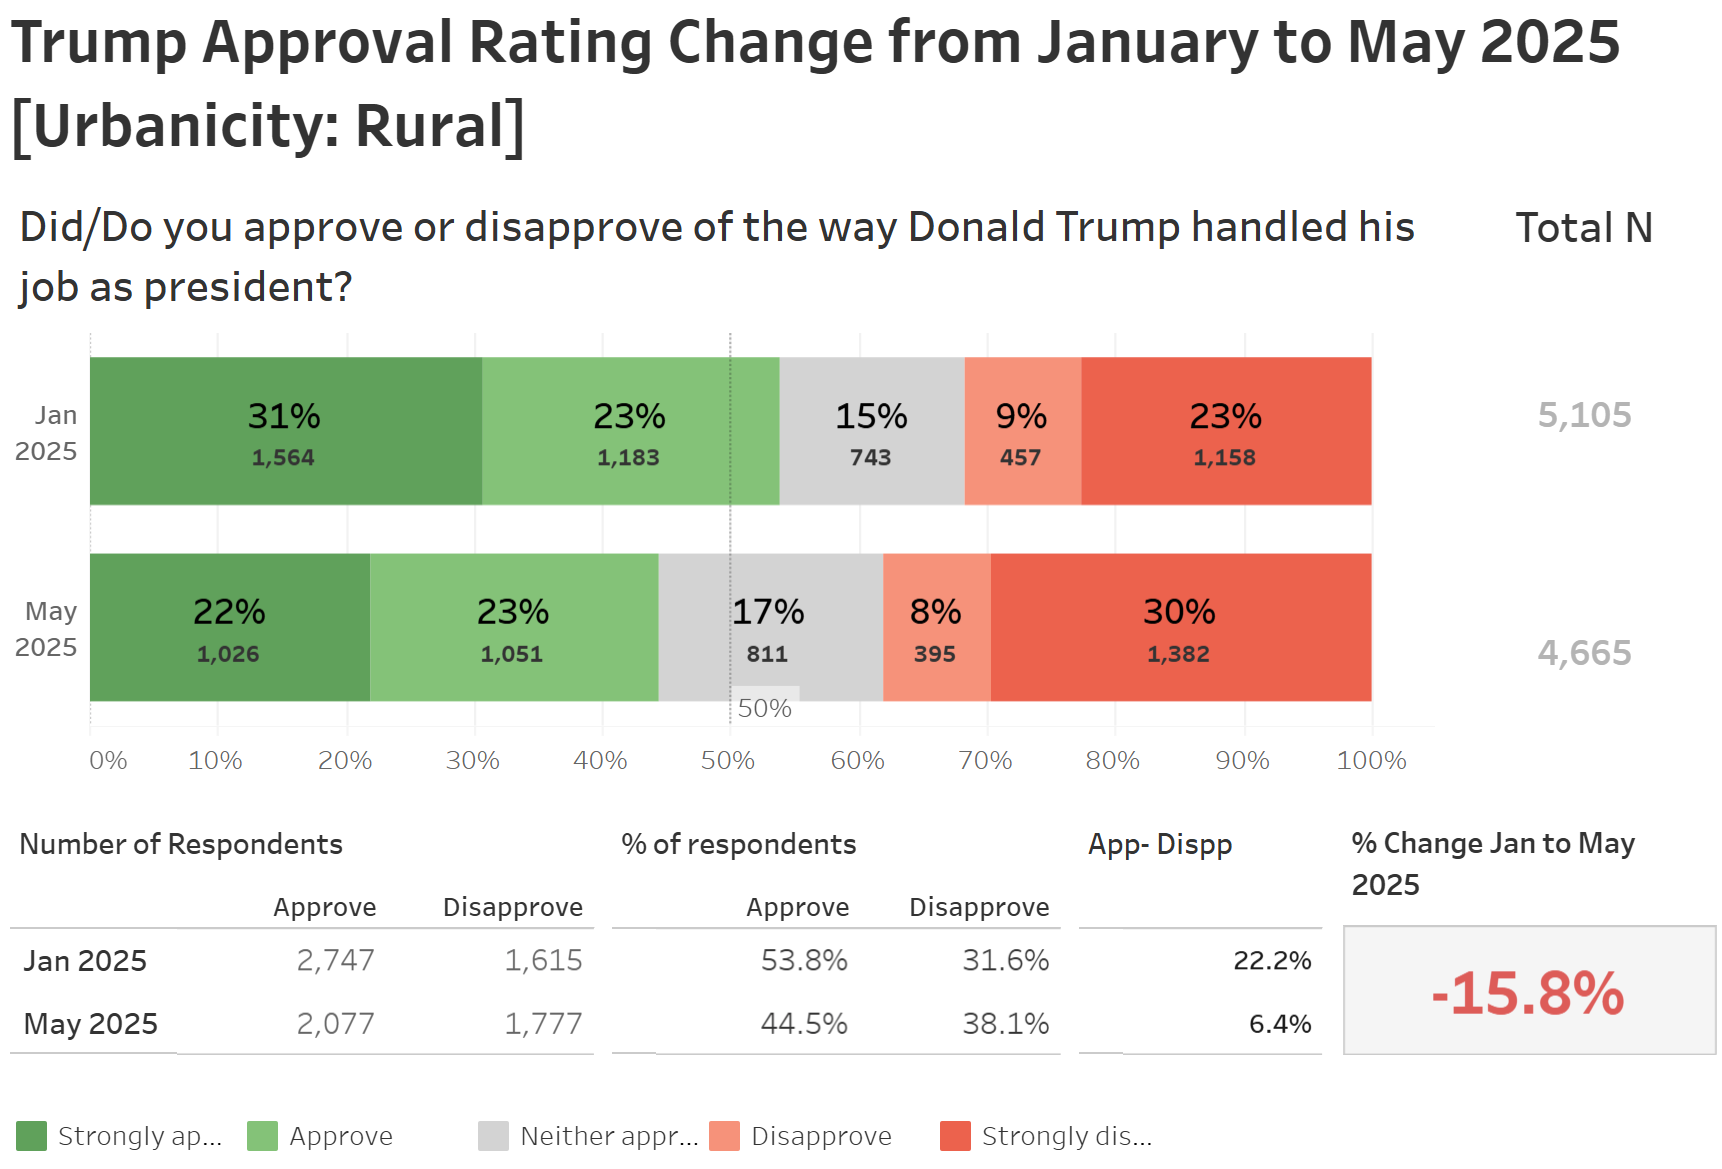
Urbanicity: big drops of approval for Trump among rural voters
One of the major divides in US politics is urban/rural. Interestingly, rural respondents have shifted away from Trump more than urban respondents (15.8% for rural versus 9% for urban, with suburban respondents at 13.7%).
Partisanship: big drops of approval for Trump among Independents and some Republicans
Finally, there have been striking partisan patterns. Approval of Trump by Independents has shifted the most, a net 23% away from Trump; however, Trump has also experienced larger drops among non-strong Republicans: 15.1% among Independents that lean Republican, and 18.4% among non-strong Republican identifiers. The shift among non-strong Republicans and Republican-leaning Independents is driven by the slices of the Republican coalition that are relatively more vulnerable to turbulent economic conditions. If one looks at white, male, affluent (earns $100,000 or more), urban Republicans, their approval of Trump has increased by 12.6%. In contrast, if you look at 30 and under non-strong Republicans, their net approval of Trump has dropped by 28.7 points; non-strong Hispanic Republicans, dropped by 27 points; non-strong Republican women, 22.3 points; non-strong less affluent (earns $50,000 or less) Republicans, dropped 21.1 points; high school or less educated non-strong Republicans 20.4 points; rural non-strong Republicans 20.2 points.

Explore Yourself!
We have an interactive tool that will allow the user to examine support among narrower slices of respondents. The scale of the data allows slicing the subsets of respondents into fairly small categories while retaining some statistical power. For example, if you look at 30 and under Hispanic women with “some high school or less” education, approval of Trump has dropped 42.8%; for non-strong Republicans 30 and under with high school or less education, approval has dropped by 36%.
Conclusion
Much of the shift towards Trump in 2024 was driven by the relatively more vulnerable in US society: the young, the less educated, the less affluent, the rural. Trump received historically impressive shares of non-white votes; and, despite the salience of gender in the election, the gender gap was typical of US Presidential elections in the 21st century. All of these groups had reasons to be unhappy with the 2024 status quo. In turn, these data suggest that in 2025, they are now turning away from Trump faster than their counterparts in the general electorate.
Note about how the race/ethnicity checkboxes work
Respondents to the survey were asked a Yes/No question for every race/ethnicity category separately. They answer Yes to multiple categories: for instance, Hispanic and White or Hispanic and Black. In this way, users of the interactive tool can select Yes or No for different combinations of race/ethnicity dropdowns to filter for subpopulations you want to include or exclude.


.png)


